Question 1
The following shows the temperatures (high, low) and weather conditions in a given Sunday for some selected world cities. For the weather conditions, the following notations are used: c = clear; cl = cloudy; sh = showers; pc = partly cloudy.
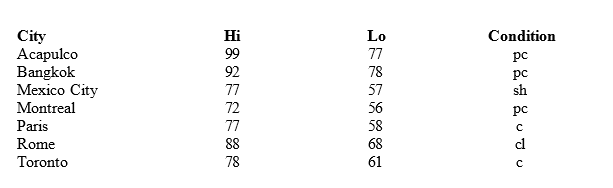
- What is an element? How many elements are in this data set? Name one.
- What is a variable? How many variables are in this data set? Name one.
- What is an observation? How many observations are in this data set? Name one.
- Name the variables and indicate whether they are categorical or quantitative.
Question 2
A student has completed 20 courses in the School of Arts and Sciences. Her grades in the 20 courses are shown below.
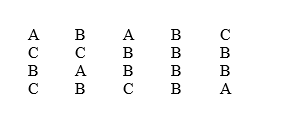
- Develop a frequency distribution table for the grades.
- Create a pie graph and a bar chart for her grades. Make sure that graphs have titles, labels, and keys.
- Which graph or chart from #2 better represents the data? Why?
Question 3
The number of hours worked per week for a sample of ten students is shown below.
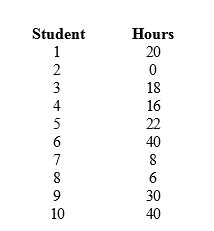
- The median is the “middle number” in a set. When a set has an even number of data points, you are supposed to average the middle two numbers to get the median. Explain why a student who averages 22 and 40 would get this problem wrong. What is the real median?
- What is the mode of the above data? What does it signify?
- What is the mean number of hours worked?
- Mean, median, and mode are all measures of central tendency. Compare the mean, median, and the mode for this data set. Which one is the best representative of the number of hours worked? Why?
Question 4
You are given the following information on Events A, B, C, and D.
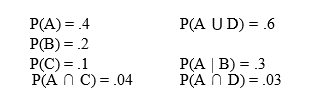
- Compute P(D). Use the Addition formula.
- Compute P(A ∩ B). Use the Conditional Probability Formula.
- Compute P(A | C).
- What is a complement? Compute the probability of the complement of C.
- The probability of getting a raise higher than the cost of living in company ABC is 0.30. The probability of getting a raise higher than the cost of living given that it is Monday in company ABC is 0.30. Are these events independent, or dependent, and why?
- When two events are mutually exclusive, will there be an intersection of data? Why or why not?
Question 5
- When a particular machine is functioning properly, 80% of the items produced are non-defective. If five items are examined, what is the probability that exactly two are defective?
Question 6
The average starting salary of this year’s graduates of a large university (LU) is $60,000 with a standard deviation of $5,000. Furthermore, it is known that the starting salaries are normally distributed.
- What is the probability that a randomly selected LU graduate will have a starting salary of at least $66,000?
- Individuals with starting salaries of less than $45,000 receive a free class. What percentage of the graduates will receive a free class?
- According to the textbook, what percentage of values fall one standard deviation from the mean? Two standard deviations from the mean?
- What are the minimum and the maximum starting salaries of the middle 95.4% of the LU graduates?
Question 7
A simple random sample of 7 computer programmers in Houston, Texas revealed the sex of the programmers and the following information about their weekly incomes.
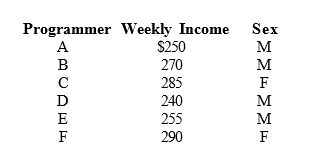
G 280 F
- What is a point estimate? (define it)
- What is the point estimate for the average weekly income of all the computer programmers in Houston?
- Determine a point estimate for the proportion of all programmers in Houston who are female.
Question 8
Students of a large university spend an average of $6 a day on lunch. The standard deviation of the expenditure is $2. A simple random sample of 81 students is taken.
- What is the probability that the sample mean will be at least $5.25?
- What is the probability that the sample mean will be at least $6.50?
- What is the range of money spent by people who fall within one standard deviation of the mean?
- Kelsey spent $12 on her lunch today. Explain to her, in terms of the normal distribution curve and standard deviation, why her purchase is not very typical.
